Mobility Index
Mobility Index is a prototype designed to test a simple idea: what if we made mobility insights and analysis easier to use, understand, and share?
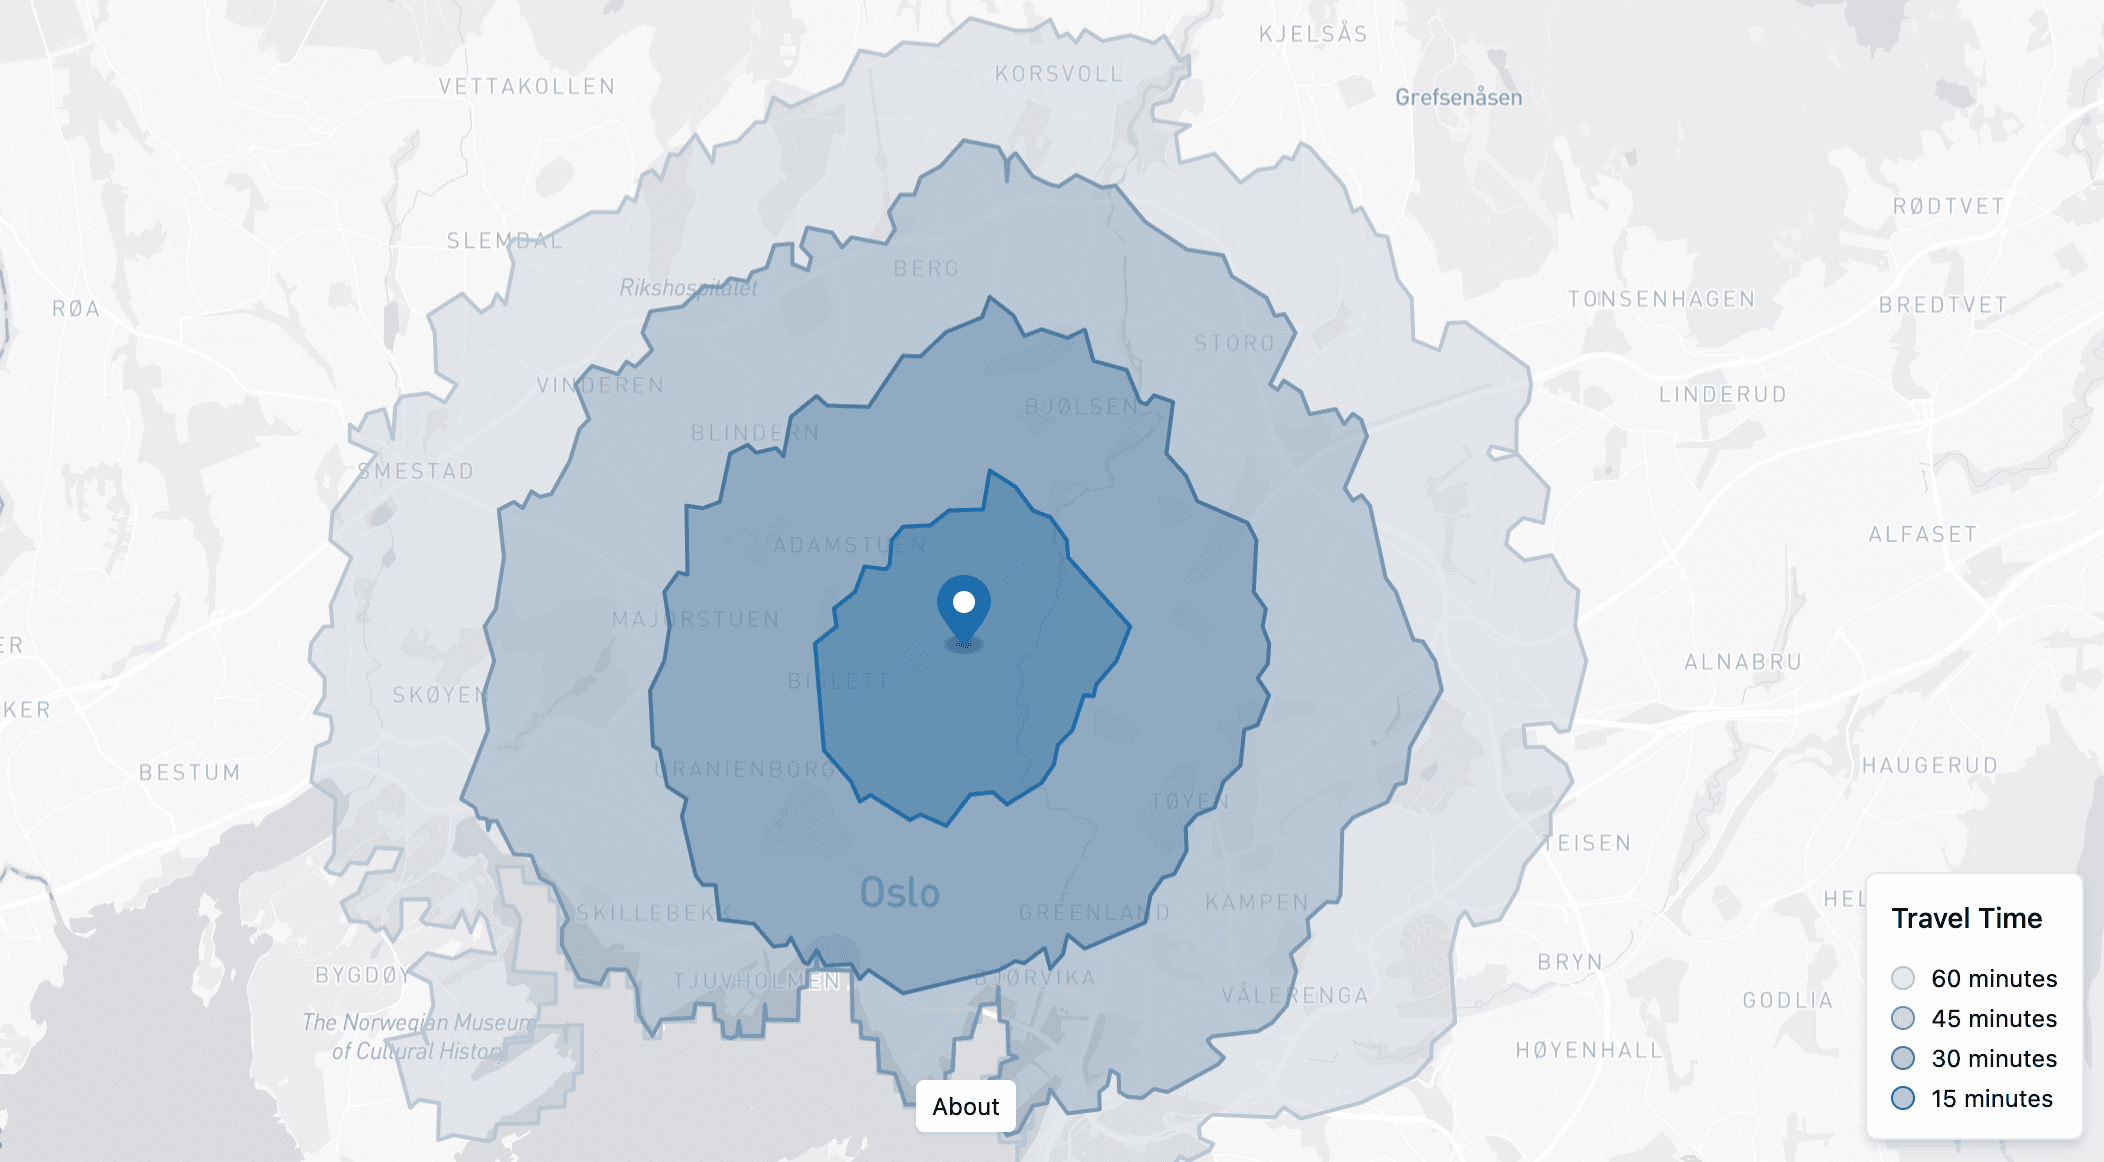
Based on the principles of the 15-minute city (shout-out to Carlos Moreno), the tool measures how far you can walk or bike from any location in a set time interval. It then starts analysing what can you reach: Jobs, schools, health services, grocery stores, parks, transit stops, everyday destinations that defines opportunity and livability.
With Mobility Index we aim to turn open data into insight, and parse the data to generate a comparable score based on what's accessible. A lightweight way to make sense of basic mobility premises without having to reach out to a GIS expert with expensive tools.
Still a work in progress
Is it perfect? Not even close. Is it finished? Definitely not. But in the spirit of our own company name, we're making it available at an early stage to start gathering feedback, learn faster, and improve together.

Ruter (PTA in Oslo) piloting with Holo, MobileEye, Moovit and Nio.
How it works
The Mobility Index starts with a single input, an address or a location clicked on the map. From there, it builds a geospatial assessment using the following steps:
Isochrone generation — we calculate the area reachable by foot or bike within 5, 15, or 30 minutes.
Contextual imagery — Street View is integrated directly, letting users explore the street-level context of the specific address.
Spatial filtering — We generate a GeoJSON polygon for the isochrone area, which acts as a filter for further analysis.
Amenity and network data — We gather data about services, public transport stops, and infrastructure within the polygon.
Scoring — Our custom scoring framework evaluates proximity, density, and diversity of reachable destinations.
Text generation — We parse the data through an LLM to generate a human-readable summary of findings, including highlights, gaps, and improvement suggestions.
Crowdsourced visuals — We search for relevant photos to add additional spatial context in the coverage area.
Data sources
The Mobility Index is built on open and updated datasets that reflect real-world infrastructure, services, and population patterns.
Mapbox — For address search, base maps, and isochrone calculations
OpenStreetMap + Overpass — For detailed infrastructure and amenity data
Google Street View — For street-level visuals
Mapillary — For crowdsourced imagery
WorldPop — For spatial demographic context
Transitland and MobilityDB — for gathering GTFS feeds
GTFS (General Transit Feed Specification) — For transit stop locations and (soon) service frequency
GBFS (General Bikeshare Feed Specification) — For shared mobility options and availability
Why it matters
Mobility shapes opportunity, but measures to improve starts with data and insight. Most mobility analysis still relies on siloed data and specialist tools.
No matter background, role or skillset we hope Mobility Index offer a way to see, not just assume, how a place supports everyday mobility. And when something scores low, help pointing out why and what's missing.